Thoughts on Managing Data Science Team Workstreams (and a Shiny app)
This post was originally published on Medium
Data Scientist (n.): Person who is better at statistics than any software engineer and better at software engineering than any statistician.
— @spite.vc on bluesky (@josh_wills) May 3, 2012
There are different types of data scientists, with different backgrounds and career paths. With Sean Murphy and Marck Vaisman, I wrote an article about this for O’Reilly a few years back, based on survey research we’d done. Download a copy, if you haven’t read it. This idea is now pretty well established, but I want to talk about a related issue, which is that the type of workthat Data Science teams do varies a lot, and that managing those types of work can be an interesting challenge.
As Josh Wills said, data scientists aren’t software developers, but they sometimes do that sort of work, and they aren’t statisticians, but they sometimes do that sort of work too. At EAB, where I lead a Data Science team of people with very diverse backgrounds and skill sets, this issue leads to a lot of complexity and experimentation as we (and the upper management I report to) try to ensure that everyone is working on the right tasks, at the right time, efficiently.
In this post, I’d like to share some thoughts about how we currently think about and manage different types of Data Science work. I also wrote a little Shiny web tool to help us manage our time, and I’ll show that off as well.
A recent innovation on our team is partial adoption of Agile/Scrum development processes. We now have daily standup meetings, two-week sprints with kickoff and retrospective meetings, and time estimation for (some of) our tasks. In general, I’m not a fan of process for its own sake, but as the team has grown, it’s become more important to have visibility into projects, to ensure that they’re on-track and not stuck or moving off on a (fascinating) tangent. So far, two of the most valuable pieces of Scrum are having processes that cause us to add more definition to projects and tasks, along with the retrospective meeting, where we review the most recent sprint and try to improve our own processes.
Scrum has limitations for us, though. For one thing, most of our projects are fairly specialized, and the standard practice of having the team as a whole estimate task difficulty is not viable when backgrounds differ so much. So we have the people who are working on a project or task estimate for themselves.
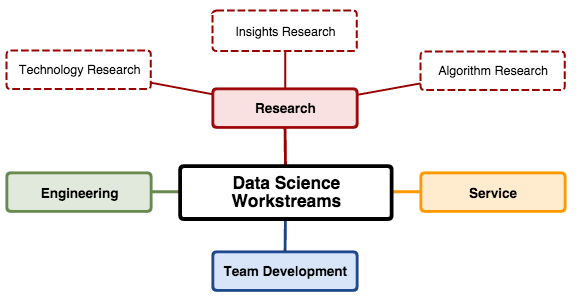
The bigger issue is the variety of workstreams. For us, we have four main categories of work:
Development– writing code for applications, either analytic services that are part of our company’s product, or internal web applications used by us or others. All of us do this work, but some data scientists specialize in this sort of work.
Research– trying to understand something better. We divide this into three subcategories:insights research is about understanding our customers’ domain and data better;algorithm research is about matching data science approaches to business needs; technology research is about improving our technology stack.
Service– repeatable operations tasks, usually customer specific, such as model-fitting or ad hoc analysis.
Team Development– interviewing, training, teaching, writing blog posts, volunteer work, etc.
Our Development work is not that different from our colleagues who sling Java all day (except that we don’t have to sling Java, thankfully). We use relatively standard Scrum processes for these tasks, including breaking down Epics into smaller Tasks, estimating those Tasks, having Task kick-off meetings to ensure requirements are clear, and of course we use modern software development processes such as git, code reviews, and continuous testing and integration.
Our Research work is a hybrid. For a six-week project, we might have a high-level project plan that keeps the work focused on specific questions to be answered, as well as a series of technical tasks that are managed mostly like Development work. If you’re trying to figure out what algorithm to use for something, you probably have tasks that look like “read papers” as well as tasks that look like “build data pipeline”. In the former case we time-box the work, to ensure that it’s targeted and not encyclopedic; in the latter case, we usually have enough information to treat the task as Development work once it’s ready to start.
Our Service work is totally different. It’s often kicked off and constrained by other teams, and we manage it with a fairly traditional Kanban process. People who have time pick up a ticket and own until it’s done. (Our primary Service tasks typically take 4 to 8 hours of work, spread out over a couple of weeks as we run into issues, resolve them, get feedback, and so on.) We track velocity, but don’t estimate it.
Finally, our Team Development work is even more ad hoc, and we don’t currently do any sort of task tracking here, aside from conversations at one-on-one meetings.
A few months back, it became clear that allocating people’s time between these workstreams was really important. Even if we were managing specific projects well, we weren’t necessarily balancing them at a high level. Because of this, we now allocate each person’s time (including mine) into the four workstreams for each two-week sprint. This helps keep people on task, and even more importantly, keeps them from taking on too much of one type of work and neglecting other projects, without having to micromanage every task or treat all tasks the same.
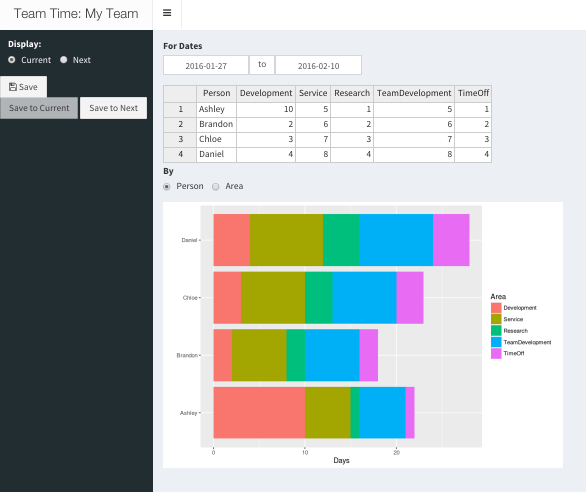
To manage and communicate this time allocation, I developed an incredibly quick-and-dirty Shiny web application called Team Time. (I’ve spent more time writing this blog post than I did on the first version of the tool!) Team Time does one thing — it manages a table of people, workstreams, and days, allows interactive editing, and shows handy summary graphs.
As you can see in the screenshot, the current version has two tables, Current and Next, so you can work on time allocation for the next sprint while you keep the table available for the current one. You can add rows (but not columns, for technical reasons) from the UI, and you can edit cells in the table. When you press Save, the table is saved and other people will see the updates when they reload.
Why is this useful? Nearly identical functionality could be built as a shared Excel or Google Sheets document. But UX matters, and many companies have grown from nothing by taking an Excel template and turning it into an easy-to-use web app. In this case, we get a tool with a simple, functional interface that does what we need, written with tools we know, and it’s accessible in a single click from our team’s web portal.
How do we use it? During our biweekly sprint kickoffs, we walk through Next, make changes from my proposed time allocation as necessary, Save it to Current, then move on to more detailed assignment of tasks to the new sprint. The total days per area give us valuable guidelines for how many points of tasks from the Development and Research backlogs should be moved into the sprint. And having this high-level view of workstreams helps people manage expectations, and provides a backdrop for retrospective meetings as well.
Over time, as we learn more, I expect the tool to continue to evolve. Better history might be handy, for reporting purposes. Synchronized changes would be fun. Maybe Zawinski’s Law will apply, and it’ll send email at some point.
As this tool is not a core competency of our company, I’ve open sourced the application, so you can use it (or improve it), if you’d like!
A sample, public version of the app is on ShinyApps. Feel free to play around with it. Right-click on the table to add/delete rows. (Note that whenever the app restarts, which it might do at arbitrary times, the tables on the disk is reset. Our copy is running inside our firewall on a copy of Shiny Server.)
The code is on GitHub, MIT licensed. A few shout-outs about handy R packages that made this possible with almost no effort. Shiny, of course, for the web app framework, and shinydashboard for the template. rhandsontable, an R wrapper for the handsontable.js Javascript library, for the interactive table. And ggplot2, magrittr, and tidyr from the Hadleyverse made the table manipulation and visualization almost trivial. Pull requests very welcome!
Oh, and if you’ll be at the Shiny Developers Conference this weekend (Jan 30th-31st, 2016), and want to chat about any of this, see you there!